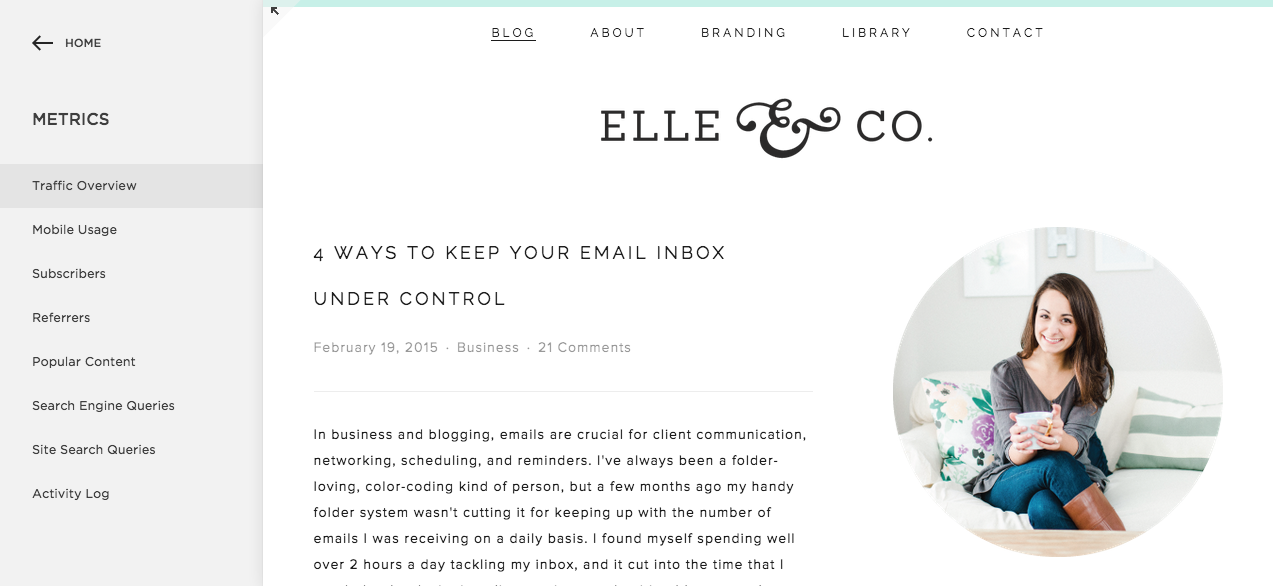
One of the things I enjoy most about Squarespace is that it's all inclusive. My domain name, site hosting, e-commerce shop, blog, custom email address, newsletter sign-up - all are in one place without any plugins or coding, and Squarespace manages it all for me. Metrics are also included, and I've been very impressed with the simple layout and variety of information that Squarespace provides for displaying my visitor activity. Today I'm taking you into the backend of my website to give you a look inside the metrics that are available within each Squarespace site. By exploring the metrics, you can learn how visitors discover your site and what they do once they're there.
Registration for the next free Elle & Company webinar, Blogging with Squarespace, is at the bottom of this post!
When you login to the backend of your site, you can access your site stats by clicking on the Metrics tab in the main panel; no separate login is required. In the new panel that appears, you can click the statistics category you want to view.
Below is a summary of each Squarespace Metric category for quick reference. If you have trouble viewing the screenshots, click on the images to see them larger.
Traffic Overview
Traffic Overview is a collection of activity on your site in its entirety. It shows a line chart of your hits including page views and unique visitors. You can filter results by hourly, daily, weekly, and monthly.
Visits
Visits represent continuous browsing events on a website with no more than a 30-minute break between interactions. For example, if you view a page every 29 minutes for three hours, this would be counted as one visit. If the same visitor views a page after a 30-minute break, a second visit is counted. Visits are a good measure of attention on your site as they correlate with a single browsing session and are frequently used in marketing applications.
Audience Size
Audience Size (often called Unique Visitors) is a good measure of total audience reach, but not necessarily engagement (Visits are a better way to gauge this).
Page View
A page view is a record of every page hit on your site that loads completely.
Mobile Usage
Mobile Usage is a breakdown of site visits from mobile devices. It shows a line chart separated by the types of devices viewing your site. You can filter results by Hourly, Daily, Weekly, and Monthly.
Subscribers
The subscribers category is a breakdown of subscribers to every RSS feed on your site. It shows an estimate number of the unique subscribers you have for each RSS feed. Squarespace attempts to count individual subscriber requests and requests from popular news readers. You can filter results by Daily, Weekly, and Monthly.
Referrers
Referrers displays the sites from which visitors arrive to your site. It shows the URLs that directed traffic to your site by percentage in a pie chart. You can filter results by 1 day, 2 days, 3 days, week, or month.
Popular Content
Popular Content is a breakdown of your most popular content based on page views. It shows the pages that receive the most traffic in a pie chart. You can filter results by 1 day, 2 days, 3 days, week, or month.
Search Queries
Search Queries displays words or strings of words that search engine users enter into search engines to successfully find your site. It shows search terms used to reach your site n a pie chart, ordered by percentage. You can filter results by 1 day, 2 days, 3 days, week, or month.
Activity Log
The Activity Log is a list of each visitor and their IP address, country, referrer, browser, operating system, pages they visit, and the date and time they visited.
Sales overview
Squarespace also provides metrics for those who use their e-commerce feature. Sales Overview provides a snapshot of your sales by the number of units sold and the revenue over time, and the stats are presented in a line chart. You can view hourly, daily, weekly, and monthly stats. You can also filter results by product.
For more information on Squarespace Metrics categories, click here.
Other notes about Squarespace metrics
- All activity in Metrics refreshes with new data about every 15 to 30 minutes.
- You can see most Metrics data for the past 12 months. Detailed activity is available for the past 7 days.
- Squarespace offers a free smartphone app for their Metrics. You can learn more about it here.
While Jake and I use Google Analytics for more in-depth metrics for Elle & Company, we've found Squarespace Metrics extremely helpful and easy to use for tracking visitor activity on our site. I frequently use the mobile app in my day-to-day, and in a business where there's so many sites and accounts to keep up with, it's nice to have everything all in one place!
What are your thoughts on Squarespace Metrics? For those of you who already use the Squarespace platform, do you utilize the data they provide?
REGISTER FOR THE NEXT ELLE & COMPANY WEBINAR!
In the live 1-hour event, we will cover:
- How to set up a blog post
- The different options for blog archives
- How to create and customize a blog sidebar
- How to schedule blog posts for a later date
- How to set up and respond to comments
And as always, I'll leave time at the end for a Q&A. Sign up below to receive a link to next week's webinar in your inbox! I look forward to seeing you there.


